Draw several plots in one figure in Python Matplotlib.pyplot
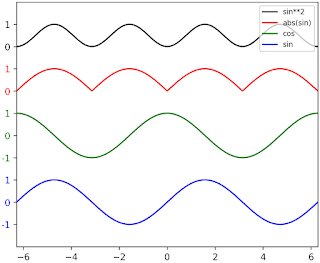
The result is:
This page shows how to plot several waveforms (like waveform data taken by an oscilloscope) in one figure.
Using offsets for each waveform, we can automatically plot using python and matplotlib.pyplot according to following code.
Subscribe to:
Comments (Atom)

