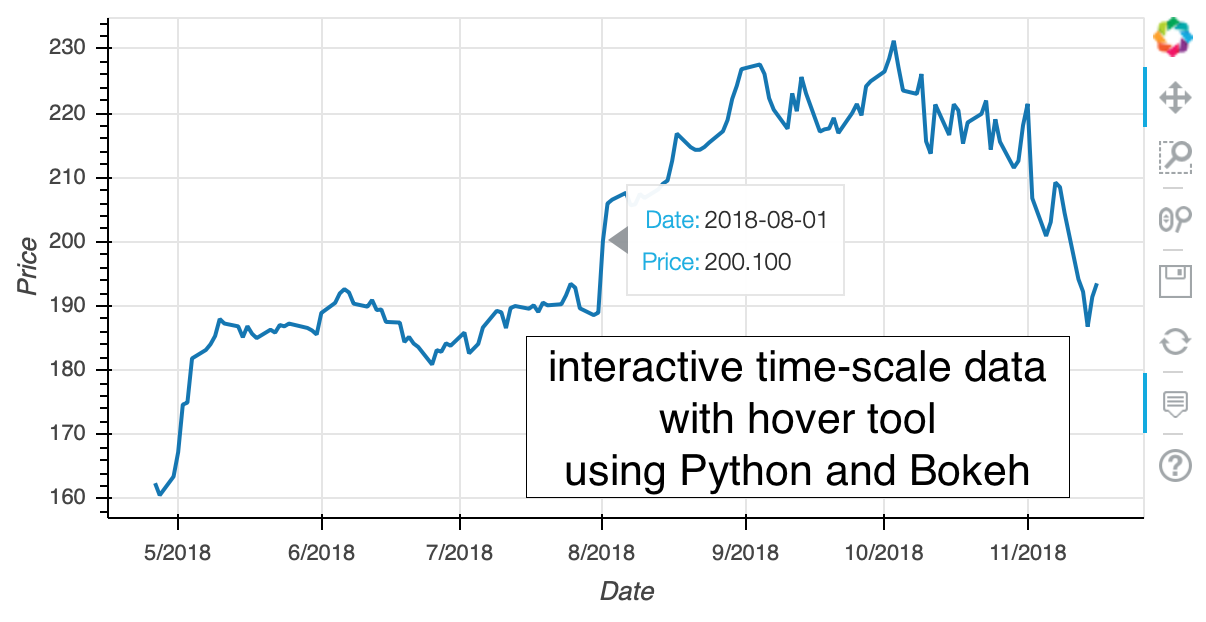
The result (static image) is:
I firstly thought that Bokeh uses matplotlib. We generate figure using matplotlib then convert the figure to the Bokeh compatible. However, it seems Bokeh works stand alone without matplotlib (is it true?) Anyway, let's check whether Bokeh works in my environment or not.