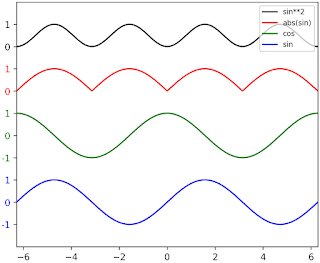
The result is:
This page shows how to plot several waveforms (like waveform data taken by an oscilloscope) in one figure.
Using offsets for each waveform, we can automatically plot using python and matplotlib.pyplot according to following code.
See also:
Python Matplotlib Tips: Plot three wave in one plot; PWM wave as example
Plot three wave in one plot; PWM wave as example
In [1]:
%matplotlib inline
import numpy as np
import matplotlib.pyplot as plt
In [2]:
t = np.linspace(-2*np.pi,2*np.pi,500)
y1 = np.sin(t)
y2 = np.cos(t)
y3 = np.abs(np.sin(t))
y4 = np.sin(t)**2
c1,c2,c3,c4 = "blue","green","red","black" # The colors of the line and ylabel
l1,l2,l3,l4 = "sin","cos","abs(sin)","sin**2" # legend names
o1,o2,o3,o4 = 0,3,5,7 # offsets
labels1 = [-1,0,1]
labels2 = [-1,0,1]
labels3 = [0,1]
labels4 = [0,1]
yticks1 = [la+o1 for la in labels1]
yticks2 = [la+o2 for la in labels2]
yticks3 = [la+o3 for la in labels3]
yticks4 = [la+o4 for la in labels4]
In [3]:
ytls = labels1+labels2+labels3+labels4
ytks = yticks1+yticks2+yticks3+yticks4
In [4]:
plt.figure(figsize=(6,5),facecolor="w")
plt.plot(t,y4+o4,color=c4,label=l4)
plt.plot(t,y3+o3,color=c3,label=l3)
plt.plot(t,y2+o2,color=c2,label=l2)
plt.plot(t,y1+o1,color=c1,label=l1)

plt.ylim(o1-2,o4+2)

plt.yticks(ytks)
plt.axes().set_yticklabels(ytls)
plt.legend(loc="upper right",fontsize=8)
plt.xlim(-2*np.pi,2*np.pi)
labs = plt.axes().get_yticklabels()
for i in range(len(labs)):
    if i < len(labels1):
        labs[i].set_color(c1)
    elif i < len(labels1+labels2):
        labs[i].set_color(c2)
    elif i < len(labels1+labels2+labels3):
        labs[i].set_color(c3)
    else:
        labs[i].set_color(c4)
plt.savefig("./align_waveforms.png",dpi=250,bbox_inches="tight",pad_inches=0.02)

