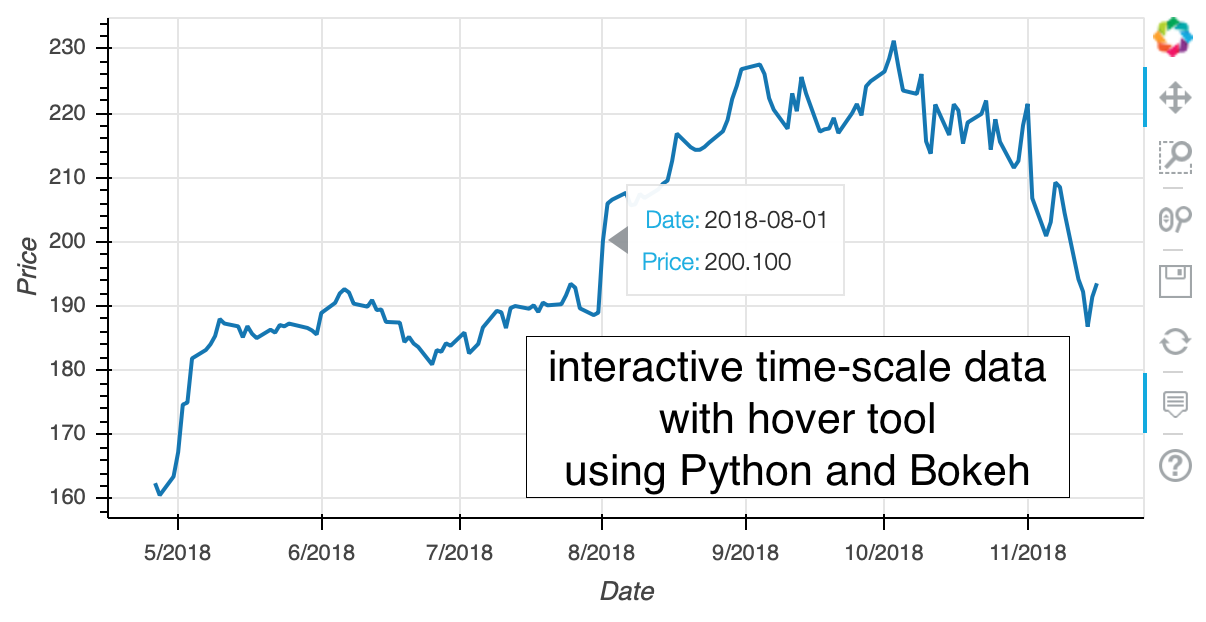
Showing posts with label Bokeh. Show all posts


Visualize my body temperature after 2nd Phizer vaccination using Python+Bokeh
The result is:
Here is my body temperature data after the 2nd Phizer vaccination at 09:50 AM, Sep. 2, 2021. Sample numbers are 1. Sample profiles are age: 20-30, sex: male, nationality: Japan. The maximum body temperature, observed at 26.2 hours after the vaccination, was 38.4 DegC.


Interactive figure with several 1D plot and one hovertools using Python and Bokeh
The result is:
This code how to generate interactive figure with several 1D plot, one hovertools and togglable legend using Python and Bokeh. This is a continuing post of last one.


Interactive figure with several 1D plot and several hovertools using Python and Bokeh
The result is:
This page shows how to generate interactive figure with several 1D plot and several hovertools using Python and Bokeh. The way to merge hovertools will be shown in the next post.


Interactive 1D time-scale plot with hovertool using Python and Bokeh
The result (static image) is:
This page shows how to generate interactive time-scale 1D line plot with hovertool (stock data) using Python and Bokeh.


Two-dimensional interactive contour plot using Python and Bokeh
The result is:
Bokeh is powerful plotting tools using nodejs. Although this code doesn't use matplotlib, I want to introduce how to generate 2D interactive contour plot using Bokeh.


Interactive plot using Bokeh - first step -
The result (static image) is:
I firstly thought that Bokeh uses matplotlib. We generate figure using matplotlib then convert the figure to the Bokeh compatible. However, it seems Bokeh works stand alone without matplotlib (is it true?) Anyway, let's check whether Bokeh works in my environment or not.
Subscribe to:
Posts (Atom)