Rotate azimuth angle and animate 3d plot_surface using Python and matplotlib.pyplot
The result is:
This page shows how to generate animation with rotating azimuth angle in the 3D surface plot using python, matplotlib.pyplot, and matplotlib.animation.FuncAnimation.
Labels:
3D,
Animation,
FuncAnimation,
Matplotlib,
Python,
Toolkit
Rotate elevation angle and animate 3d plot_surface using Python and matplotlib.pyplot
The result is:
This page shows how to generate animation with rotating elevation angle in the 3D surface plot using python, matplotlib.pyplot, and matplotlib.animation.FuncAnimation.
Labels:
3D,
Animation,
FuncAnimation,
Matplotlib,
Python,
Toolkit
Compare plt.plot and plt.scatter in speed in Python and Matplotlib.pyplot
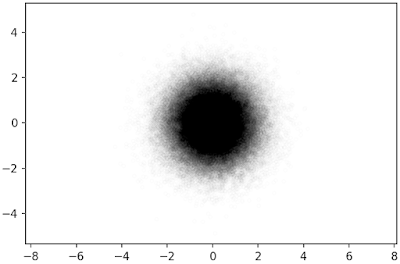
This page compares the speed of "plt.plot" and "plt.scatter" to generate same following figure:
It seems that "plt.plot" is faster than "plt.scatter" to plot simple and large point scatter plot.
Kernel density estimation using Python, matplotlib.pyplot and scipy.stats.gaussian_kde
The result is:
This page shows how to change the color of the scatter point according to the density of the surrounding points using python and scipy.stats.gaussian_kde and matplotlib.
Check the url is indexed by Google using Python
Indexed by Google is crucial to increase the number of the visitor to the site. You can check whether the URL is indexed by Google or not using Python. This page shows how to do it for all blog posts. The URLs of the blog posts are extracted from the sitemap. So, you can use this code for your page by just modifying the sitemap URL. If you know how to use Heroku, crontab or such light resources which enable regularly execution of scripts, and if you know how to send an e-mail using python, you can report the indexed/not-indexed page for hourly, daily, weekly or whenever you want. The notebook below is the example of the indexed/not-indexed URL list when this post is written.
Add second x-axis below first x-axis using Python and matplotlib.pyplot
The result is:
This page shows how to draw second x-axis below the first x-axis. Using "twinx", "set_ticks_position", and "set_label_position", and "spines['bottom'].set_position", you can move the second x-axis from the top of the figure to below the first x-axis.
Add second x-axis at top of figure using Python and matplotlib.pyplot
The result is:
This page shows how to add second x-axis at the top of the figure using python and matplotlib.pyplot. Using "twinx" funcion, you can add x-axis at the top of the figure.
Solve and animate single pendulum using scipy.odeint and matplotlib.animation.ArtistAnimation
The result is:
This page shows the example of the scipy.odeint function with solving the motion of the single pendulum. The result is converted to the animation using matplotlib.animation.ArtistAnimation.
Labels:
Animation,
ArtistAnimation,
Matplotlib,
Ode,
Python,
Simulation
Try using all mathtext fontset in python and matplotlib.pyplot
The result (computer modern: cm) is:
In this page, I try using all mathtext fontset in python and matplotlib.pyplot. It seems that the resulting text of \mathbb{hogehoge}, \mathrm{\mathbb{hogehgoe}}, \mathfrak{hogehoge}, \mathsf{hogehoge}, and \mathrm{\mathsf{hogehoge}} are same.
Generate average image using Python and PIL (Python Image Library)
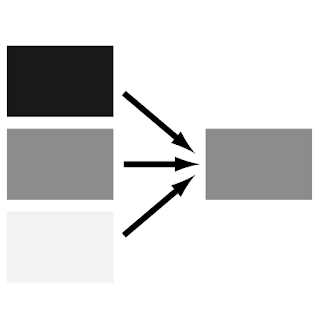
This page shows how to generate an average image of the image arrays using python and PIL (python image library) module.
It is easy to do by converting the image to the numpy.array.
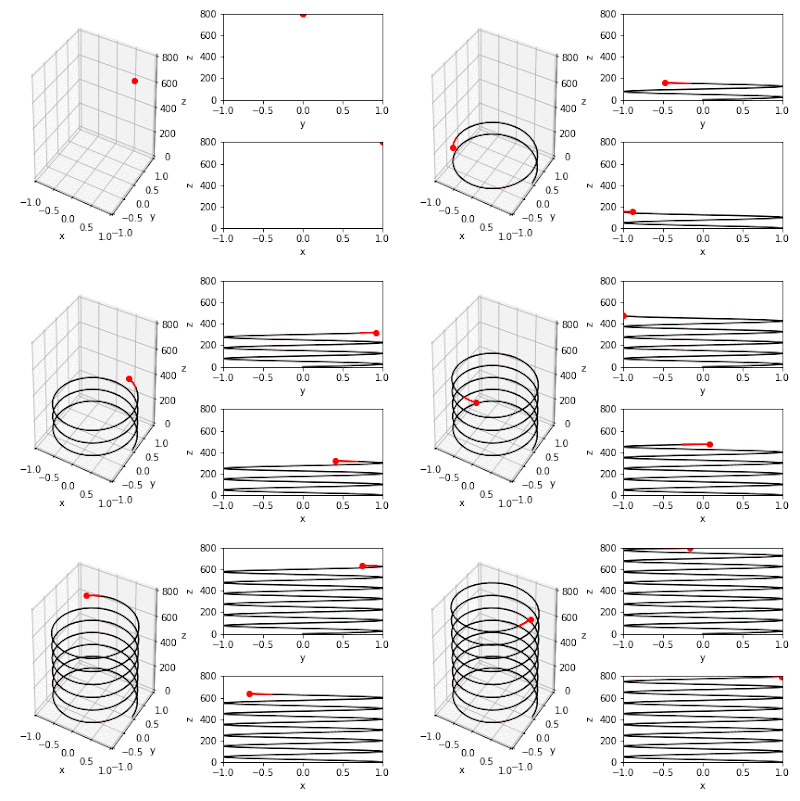
Combine 3D and two 2D animations in one figure using python, matplotlib.pyplot and animation.ArtistAnimation
The result is:
This page shows how to combine 3D and 2D animations in one figure using python, matplotlib.pyplot, and animation.artistanimation function.
Labels:
3D,
Animation,
ArtistAnimation,
Matplotlib,
Python,
Toolkit
Combine 3D and two 2D animations in one figure using python, matplotlib.pyplot and animation.timedanimation
The result is:
This page shows how to combine 3D and 2D animations in one figure using python, matplotlib.pyplot, and animation.timedanimation function.
Combine two 2D animations in one figure using python, matplotlib.pyplot and animation.artistanimation
The result is:
This code shows how to combine two 2D animations in one figure using python, matplotlib.pyplot, and matplotlib.animation.
Combine two 2D animations in one figure using python, matplotlib.pyplot and animation.timedanimation
The result is:
This code shows how to combine two 2D animations in one figure using python, matplotlib.pyplot, and matplotlib.animation.
Plot three wave in one plot; PWM wave as example
The result is:
This page shows an example of a plot with three waves in one axes using offsets. The PWM wave is the objective.
Subscribe to:
Comments (Atom)


