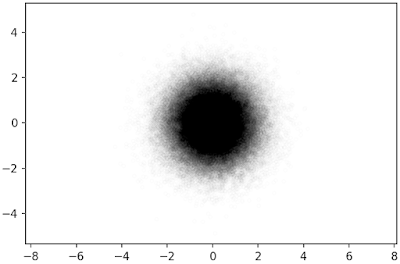
This page compares the speed of "plt.plot" and "plt.scatter" to generate same following figure:
It seems that "plt.plot" is faster than "plt.scatter" to plot simple and large point scatter plot.
In [1]:
%matplotlib inline
import matplotlib.pyplot as plt
import numpy as np
from numpy import random
In [2]:
Nsample = 1000
xx = random.normal(size=Nsample)
yy = random.normal(size=Nsample)
plt.plot
In [3]:
%%timeit -n 3 -r 1
ax = plt.subplot(1,1,1)
ax.plot(xx, yy, 'o', markerfacecolor='none', markeredgecolor='k', alpha=0.5, markersize=3)
ax.set_aspect('equal','datalim')
plt.savefig('pltplot1.png', dpi=150, bbox_inches='tight', pad_inches=0.02)
plt.show()
plt.scatter
In [4]:
%%timeit -n 3 -r 1
ax = plt.subplot(1,1,1)
ax.scatter(xx, yy, marker='o', facecolors='none', edgecolors='k',alpha=0.5, s=9)
ax.set_aspect('equal','datalim')
plt.savefig('pltscatter1.png', dpi=150, bbox_inches='tight', pad_inches=0.02)
plt.show()
When the Nsample is small, the difference between plt.plot and plt.scatter is also small.
Let's increase the Nsample.
Let's increase the Nsample.
In [5]:
Nsample = 100000
xx = random.normal(size=Nsample)
yy = random.normal(size=Nsample)
plt.plot
In [6]:
%%timeit -n 3 -r 1
ax = plt.subplot(1,1,1)
ax.plot(xx, yy, 'o', markerfacecolor='none', markeredgecolor='k', alpha=0.01, markersize=3)
ax.set_aspect('equal','datalim')
plt.savefig('pltplot2.png', dpi=150, bbox_inches='tight', pad_inches=0.02)
plt.show()
plt.scatter
In [7]:
%%timeit -n 3 -r 1
ax = plt.subplot(1,1,1)
ax.scatter(xx, yy, marker='o', facecolors='none', edgecolors='k',alpha=0.01, s=9)
ax.set_aspect('equal','datalim')
plt.savefig('pltscatter2.png', dpi=150, bbox_inches='tight', pad_inches=0.02)
plt.show()
The difference is quite large. It seems that "plt.scatter" function is slower than "plt.plot" function. However, you can change the color of each point in the "plt.scatter" function as shown in Kernel density estimation using Python, matplotlib.pyplot and scipy.stats.gaussian_kde.
