The result is:

Here is my body temperature data after the 2nd Phizer vaccination at 09:50 AM, Sep. 2, 2021. Sample numbers are 1. Sample profiles are age: 20-30, sex: male, nationality: Japan. The maximum body temperature, observed at 26.2 hours after the vaccination, was 38.4 DegC.
See also:
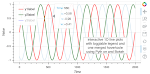
This code how to generate interactive figure with several 1D plot, one hovertools and togglable legend using Python and Bokeh.
 pythonmatplotlibtips.blogspot.com
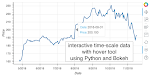
Python Matplotlib Tips: Interactive 1D time-scale plot with hovertool using Python and Bokeh
This page shows how to generate interactive time-scale 1D line plot with hovertool (stock data) using Python and Bokeh.
 pythonmatplotlibtips.blogspot.com
In [1]:
# Phizer #2 2021.09.02 09:50 AM JST
In [2]:
import platform
print('python: '+platform.python_version())
import dateutil
import pandas as pd
print('pandas: '+pd.__version__)
from bokeh.plotting import figure, output_notebook, figure, show
from bokeh.models import ColumnDataSource, HoverTool, WheelZoomTool, PanTool, ResetTool, Span
from bokeh.io import save
output_notebook()
In [3]:
# Vaccination time
timevax = '2021-09-02 09:50:00'

# Body temperature data
tempdata = [
    ['2021-09-01 19:00:00', 36.8],
    ['2021-09-01 23:30:00', 36.4],
    ['2021-09-02 07:50:00', 36.7],
    ['2021-09-02 09:10:00', 36.7],
    ['2021-09-02 10:15:00', 37.0],
    ['2021-09-02 11:00:00', 36.7],
    ['2021-09-02 11:20:00', 36.7],
    ['2021-09-02 11:30:00', 36.7],
    ['2021-09-02 11:50:00', 36.5],
    ['2021-09-02 12:40:00', 36.7],
    ['2021-09-02 13:00:00', 36.7],
    ['2021-09-02 13:15:00', 36.8],
    ['2021-09-02 13:30:00', 36.5],
    ['2021-09-02 13:50:00', 36.7],
    ['2021-09-02 14:10:00', 37.0],
    ['2021-09-02 14:20:00', 36.9],
    ['2021-09-02 14:30:00', 36.8],
    ['2021-09-02 14:40:00', 36.7],
    ['2021-09-02 15:00:00', 36.9],
    ['2021-09-02 15:10:00', 36.7],
    ['2021-09-02 15:20:00', 36.8],
    ['2021-09-02 15:35:00', 36.8],
    ['2021-09-02 15:55:00', 36.6],
    ['2021-09-02 16:15:00', 36.7],
    ['2021-09-02 16:30:00', 36.8],
    ['2021-09-02 16:40:00', 36.7],
    ['2021-09-02 16:40:00', 36.7],
    ['2021-09-02 16:50:00', 36.7],
    ['2021-09-02 16:50:00', 36.7],
    ['2021-09-02 17:05:00', 36.7],
    ['2021-09-02 17:20:00', 36.8],
    ['2021-09-02 17:35:00', 36.6],
    ['2021-09-02 17:45:00', 36.8],
    ['2021-09-02 17:55:00', 36.8],
    ['2021-09-02 18:10:00', 36.8],
    ['2021-09-02 18:40:00', 36.9],
    ['2021-09-02 18:55:00', 37.0],
    ['2021-09-02 19:10:00', 36.9],
    ['2021-09-02 19:25:00', 36.8],
    ['2021-09-02 19:40:00', 37.0],
    ['2021-09-02 20:00:00', 37.1],
    ['2021-09-02 20:20:00', 36.8],
    ['2021-09-02 21:20:00', 36.9],
    ['2021-09-02 21:40:00', 36.9],
    ['2021-09-02 21:55:00', 36.8],
    ['2021-09-02 22:10:00', 36.9],
    ['2021-09-02 22:35:00', 36.9],
    ['2021-09-02 22:45:00', 36.7],
    ['2021-09-02 23:00:00', 36.8],
    ['2021-09-02 23:20:00', 37.0],
    ['2021-09-03 01:20:00', 37.6],
    ['2021-09-03 02:40:00', 37.9],
    ['2021-09-03 02:50:00', 38.0],
    ['2021-09-03 03:00:00', 37.9],
    ['2021-09-03 03:10:00', 37.7],
    ['2021-09-03 03:20:00', 37.9],
    ['2021-09-03 03:30:00', 37.9],
    ['2021-09-03 07:40:00', 37.3],
    ['2021-09-03 07:50:00', 37.5],
    ['2021-09-03 08:10:00', 37.3],
    ['2021-09-03 08:30:00', 37.2],
    ['2021-09-03 08:50:00', 37.3],
    ['2021-09-03 09:00:00', 37.2],
    ['2021-09-03 09:20:00', 37.3],
    ['2021-09-03 09:40:00', 37.1],
    ['2021-09-03 09:50:00', 37.1],
    ['2021-09-03 10:10:00', 37.4],
    ['2021-09-03 10:30:00', 37.1],
    ['2021-09-03 10:50:00', 37.6],
    ['2021-09-03 11:00:00', 37.7],
    ['2021-09-03 11:45:00', 38.2],
    ['2021-09-03 12:00:00', 38.4],
    ['2021-09-03 12:15:00', 38.0],
    ['2021-09-03 12:35:00', 38.2],
    ['2021-09-03 13:10:00', 38.2],
    ['2021-09-03 13:50:00', 38.1],
    ['2021-09-03 14:20:00', 37.9],
    ['2021-09-03 14:40:00', 37.6],
    ['2021-09-03 15:10:00', 36.8],
    ['2021-09-03 15:25:00', 37.2],
    ['2021-09-03 15:40:00', 37.3],
    ['2021-09-03 15:55:00', 37.2],
    ['2021-09-03 16:30:00', 37.7],
    ['2021-09-03 16:40:00', 37.8],
    ['2021-09-03 17:00:00', 37.5],
    ['2021-09-03 17:20:00', 37.6],
    ['2021-09-03 17:40:00', 38.1],
    ['2021-09-03 18:10:00', 38.0],
    ['2021-09-03 18:35:00', 37.5],
    ['2021-09-03 19:10:00', 37.0],
    ['2021-09-03 19:30:00', 38.1],
    ['2021-09-03 19:40:00', 37.8],
    ['2021-09-03 20:00:00', 38.0],
    ['2021-09-03 20:10:00', 37.9],
    ['2021-09-03 20:20:00', 37.9],
    ['2021-09-03 20:45:00', 37.7],
    ['2021-09-03 21:00:00', 37.9],
    ['2021-09-03 21:10:00', 37.6],
    ['2021-09-03 21:30:00', 37.7],
    ['2021-09-03 22:45:00', 37.0],
    ['2021-09-04 04:20:00', 37.4],
    ['2021-09-04 04:45:00', 36.7],
    ['2021-09-04 05:00:00', 37.1],
    ['2021-09-04 05:15:00', 37.1],
    ['2021-09-04 05:25:00', 37.1],
    ['2021-09-04 06:10:00', 36.8],
    ['2021-09-04 07:00:00', 36.7],
    ['2021-09-04 07:55:00', 37.1],
    ['2021-09-04 08:25:00', 37.1],
    ['2021-09-04 08:25:00', 36.9],
    ['2021-09-04 08:45:00', 36.9],
    ['2021-09-04 09:20:00', 37.1],
    ['2021-09-04 10:05:00', 37.0],
    ['2021-09-04 10:45:00', 36.9],
    ['2021-09-04 11:00:00', 36.9],
    ['2021-09-04 11:50:00', 37.0],
    ['2021-09-04 13:00:00', 36.7],
    ['2021-09-04 13:40:00', 37.0],
    ['2021-09-04 14:30:00', 37.0],
    ['2021-09-04 15:10:00', 37.1],
    ['2021-09-04 16:20:00', 37.0],
    ['2021-09-04 17:20:00', 37.0],
    ['2021-09-04 18:00:00', 36.9],
    ['2021-09-04 19:00:00', 37.0],
    ['2021-09-04 20:00:00', 36.8],
    ['2021-09-04 20:40:00', 36.8],
    ['2021-09-04 21:10:00', 36.7],
    ['2021-09-04 22:10:00', 36.9],
    ['2021-09-04 22:40:00', 36.9],
    ['2021-09-04 23:30:00', 36.8],
]

# Acetaminophen dose
timedose = [
    '2021-09-03 02:50:00',
    '2021-09-03 12:00:00',
]

# Transpose
tempdata = list(zip(*tempdata))
In [4]:
# Convert data to pandas Series
time = pd.Series(tempdata[0], name='Time', dtype='datetime64[ns]')
temp = pd.Series(tempdata[1], name='Temp')
elps= time - dateutil.parser.parse(timevax) # Elapsed time from vaccination
elps = elps.apply(lambda t: '%.1f' % (t.total_seconds()/3600))
dose = pd.Series(timedose, name='Dose', dtype='datetime64[ns]')

# Moving average
nwindow = 5
timema = pd.Series(time.values.astype('float64'), name='Timema').rolling(window=nwindow, center=True).mean()
timema = timema.astype('datetime64[ns]')
tempma = pd.Series(temp, name='Tempma').rolling(window=nwindow, center=True).mean()
In [5]:
# Generate figure

# Configuration
src = ColumnDataSource(
    data={
        'Time': time,
        'Elps': elps,
        'Temp': temp,
        'Timema': timema,
        'Tempma': tempma,
        }
    )
hov = HoverTool(
    tooltips=[
        ('Date', '@Time{%m/%d %a}'),
        ('Time', '@Time{%H:%M}'),
        ('Elaps', '@Elps'),
        ('Temp', '@Temp{0.f}')],
    mode='vline',
    formatters={
        '@Time': 'datetime'}
    )
pan = PanTool()
wzm = WheelZoomTool(dimensions='width')
p = figure(
    title='My body temperature after Phizer #2',
    y_range=(36.0, 39.0),
    width_policy='max',
    x_axis_type='datetime',
    x_axis_label='Date, time',
    y_axis_label='Body temperature [DegC]',
    tools=[pan, wzm, ResetTool(), hov],
    active_drag=pan,
    active_scroll=wzm,
)
p.axis.axis_label_text_font_style = 'normal'

# Plot body temperature data
bt = p.line('Time', 'Temp', source=src,
            line_color='orange', legend_label='Body temp.')
p.hover.renderers = [bt] # Prevent other data from being added to hover.

# Plot moving averaged body temperature
p.line('Timema', 'Tempma', source=src,
       line_color='red', line_dash='dashed',
       legend_label='%d pts. m.a. of body temp.' % nwindow, line_width=2)

# Draw vertical lines to show acetaminophen dose time
for _t in dose:
    vldose = Span(location=_t, dimension='height', line_color='blue', line_width=1)
    p.renderers.extend([vldose])

# Draw vertical line to show vaccination time
vltvax = Span(location=dateutil.parser.parse(timevax), dimension='height', line_color='black', line_width=1)
p.renderers.extend([vltvax])

# Dummy data to show labels in legend
p.line([], [], line_color='blue', line_width=1, legend_label='Acetaminophen dose time')
p.line([], [], line_color='black', line_width=1, legend_label='Vaccination time')

show(p)