The result is:

This page shows how to generate interactive figure with several 1D plot and several hovertools using Python and Bokeh. The way to merge hovertools will be shown in the next post.
See also:
Python Matplotlib Tips: Interactive 1D time-scale plot with hovertool using Python and Bokeh
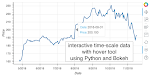
This page shows how to generate interactive time-scale 1D line plot with hovertool (stock data) using Python and Bokeh.
 pythonmatplotlibtips.blogspot.com
Python Matplotlib Tips: Interactive plot using Bokeh - first step -
I firstly thought that Bokeh uses matplotlib. We generate figure using matplotlib then convert the figure to the Bokeh compatible. However, it seems Bokeh works stand alone without matplotlib (is it true?) Anyway, let's check whether Bokeh works in my environment or not.
 pythonmatplotlibtips.blogspot.com
In [5]:
import datetime
import platform
print('python: '+platform.python_version())
import numpy as np
print('numpy: '+np.__version__)
Define x and y value
In [6]:
numdays = 2000
base = datetime.datetime.strptime('2018-02-02 18:30:00', '%Y-%m-%d %H:%M:%S')
xs = [base + datetime.timedelta(minutes=x*10) for x in range(0, numdays)]
ys1 = np.sin(np.linspace(0,10*np.pi,numdays))
ys2 = np.sin(np.linspace(0,10*np.pi,numdays)+2*np.pi/3)
ys3 = np.sin(np.linspace(0,10*np.pi,numdays)+4*np.pi/3)
Load bokeh and enable notebook connection
In [7]:
from bokeh.plotting import figure, output_file, show
from bokeh.io import output_notebook
from bokeh.models.tools import HoverTool
output_notebook()
Generate interactive plot
In [8]:
# define figure
p = figure(x_axis_type="datetime", x_axis_label='Time', y_axis_label='Value',
           plot_width=600, plot_height=300)


# plot a line to the figure
l1 = p.line(xs, ys1, line_width=2, color='red')
l2 = p.line(xs, ys2, line_width=2, color='green')
l3 = p.line(xs, ys3, line_width=2, color='blue')

# add hover tools to the figure
p.add_tools(HoverTool(
    renderers=[l1,l2,l3],
    # you can see the detail of the formatter at:
    # https://bokeh.pydata.org/en/latest/docs/reference/models/formatters.html
    tooltips=[('Time','@x{%F %H:%M}'),('Value', '@y'),],
    formatters={'x':'datetime',},
    # display a tooltip whenever the cursor is vertically in line with a glyph
    mode='vline'
    ))

# display the figure in the notebook
show(p)