Plot electric field lines around a point charge with grounded sphere using Python Matplotlib.pyplot
The result is :
This page shows the method to draw electric field line around a point charge adjecent to a grounded sphere using method of image charges.
Labels:
Contour,
Matplotlib,
Python,
Simulation,
VectorField
Draw electric field lines due to point charges using Python Matplotlib.pyplot
The results are:
and
This code shows how to visualize streamlines with continuous lines using python and matplotlib.pyplot.
When you search "electric field lines python" or something in Google, you would see the images which use the streamplot. Although it is easy way to visualize the direction of the vector fields, electric field must be continuous lines as you know. In this page, electric field lines around the point charges are calculated using scipy.ode (ordinary differential equations) module.
This code is based on following wonderful tips blog posts:
The effect of pad_inches in Python Matplotlib.pyplot
The results are:
This page shows how to change pad_inches and how it affect on the saved figure in python and matplotlib.pyplot.
Display same figure with changing lines color and math fonts
The example of the result (computer modern) is:
This page show how to display several font all at once.
Computer modern, stix (Times New Roman), arial, cambria and arial (with colored line) are displayed.
Computer modern, stix (Times New Roman), arial, cambria and arial (with colored line) are displayed.
Draw minor ticks at arbitrary place using Python Matplotlib.pyplot
In [1]:
import matplotlib.pyplot as plt
import numpy as np
from itertools import product
from matplotlib import ticker
%matplotlib inline
In [2]:
plt.figure(figsize=(4,3),facecolor="w")
plt.plot([0,1],[0,1])
minors = [0.1,0.12,0.125,0.15,0.16,0.17,0.18,0.19]
plt.axes().xaxis.set_minor_locator(ticker.FixedLocator(minors))
plt.tick_params(which='minor', length=3, color='r')
In [3]:
plt.figure(figsize=(4,3),facecolor="w")
plt.plot(np.log10([1,100]),np.log10([1,100]))
xtks = np.array([1,10,100])
xtkp = np.log10(xtks)
plt.axes().set_xticks(xtkp)
plt.axes().set_xticklabels(xtks)
ytks = np.array([1,10,100])
ytkp = np.log10(ytks)
plt.axes().set_yticks(ytkp)
plt.axes().set_yticklabels(ytks)
xminors = np.log10([2,3,5,20,30,40,50,60,70,80,90])
yminors = np.log10(([k*m for k,m in product([2,3,4,5,6,7,8,9],[1,10])]))
plt.axes().xaxis.set_minor_locator(ticker.FixedLocator(xminors))
plt.axes().yaxis.set_minor_locator(ticker.FixedLocator(yminors))
plt.tick_params(which='minor', length=3, color='k')
Draw animation graph using Python Matplotlib.pyplot
The result is:
This page shows an example of the animation generated by the matplotlib.pyplot of python.
Simple way to draw 3D random walk using Python and Matplotlib.pyplot
The result is:
This code shows the simple way to dray 3D random walk with colored line using python.
Make figures changing math font in Python Matplotlib.pyplot
The example of the result (computer modern font) is:
This page shows how to change text font of the labels, ticks and mathtext.
Write \mu (Greek letter, Symbol) in Python Matplotlib.pyplot
The results are:
This page shows how to write μ:mu, \mu in the matplotlib. By specifying the Unicode, you can add arbitrary character to the plot.
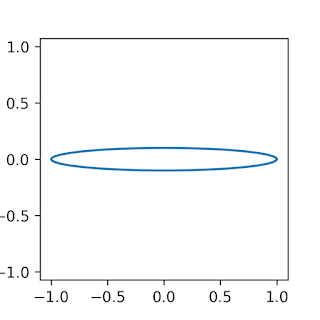
How to set the aspect ratio of the figure in Python Matplotlib.pyplot
The result is:
This page show how to set the aspect ratio of the figure in the python and matplotlib.pyplot. By adding set_aspect function, you can set the aspect ratio ot equal.
Subscribe to:
Posts (Atom)


