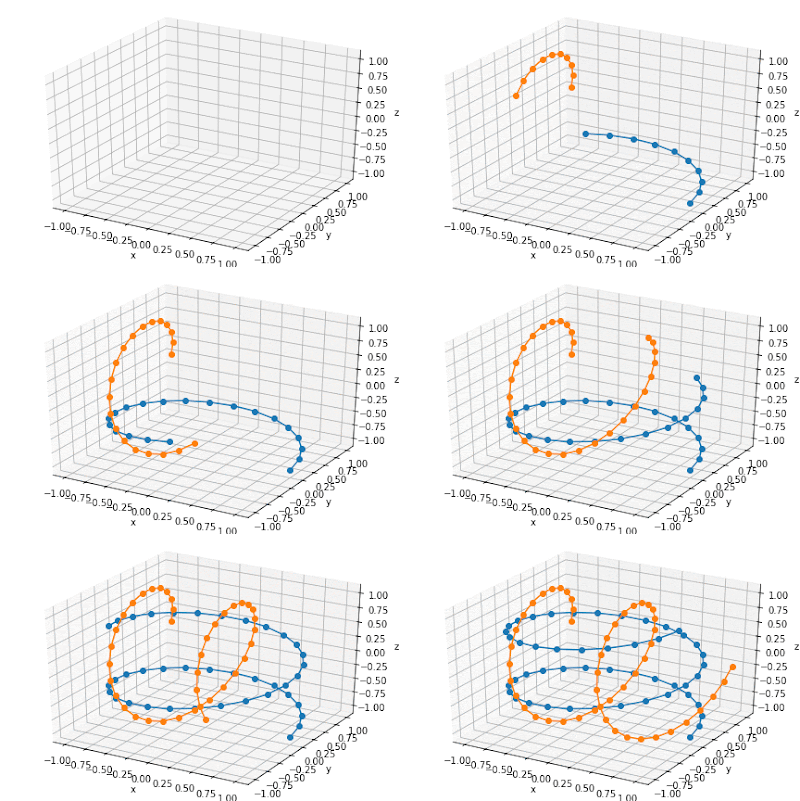
The result is:
This page shows how to draw 3D line animation using python & matplotlib. Note that you must install ffmpeg and imagemagick to properly display the result.
This code is based on following web sites:
- animation example code: simple_3danim.py - matplotlib -
- 3D animation using matplotlib - stackoverflow -
In [1]:
import numpy as np
import matplotlib.pyplot as plt
import mpl_toolkits.mplot3d.axes3d as p3
import matplotlib.animation as animation
from IPython.display import HTML
Define a function which is called by the animation.Funcanimation
In [2]:
def update_lines(num, dataLines, lines):
    for line, data in zip(lines, dataLines):
        # NOTE: there is no .set_data() for 3 dim data...
        line.set_data(data[0:2, :num])
        line.set_3d_properties(data[2, :num])
        line.set_marker("o")
    return lines
Draw the animation
In [3]:
# Attaching 3D axis to the figure
fig = plt.figure()
ax = p3.Axes3D(fig)

# Lines to plot in 3D
t = np.linspace(-2*np.pi,2*np.pi,50)
x1, y1, z1 = np.cos(t), np.sin(t), t/t.max()
x2, y2, z2 = t/t.max(), np.cos(t), np.sin(t)
data = np.array([[x1,y1,z1],[x2,y2,z2]])

# NOTE: Can't pass empty arrays into 3d version of plot()
lines = [ax.plot(dat[0, 0:1], dat[1, 0:1], dat[2, 0:1])[0] for dat in data]

ax.set_xlim(-1.1,1.1)
ax.set_ylim(-1.1,1.1)
ax.set_zlim(-1.1,1.1)
ax.set_xlabel("x")
ax.set_ylabel("y")
ax.set_zlabel("z")
plt.rcParams['animation.html'] = 'html5'

line_ani = animation.FuncAnimation(fig, update_lines, 50, fargs=(data, lines),
                                   interval=100, blit=True, repeat=True)

# The empty figure shown below is unknown.
# Does anyone know how to delete this?
Then display the result
In [4]:
line_ani
Out[4]:
Save the figure
In [5]:
line_ani.save('line_animation_3d_funcanimation.mp4', writer='ffmpeg',fps=1000/100)
line_ani.save('line_animation_3d_funcanimation.gif', writer='imagemagick',fps=1000/100)
