Pcolor with cut data below lower limit using Python and matplotlib.pyplot
The result is:
This page shows how to generate pcolor graph with a data whose small values below minimum limit are cut using python and matplotlib.
Convert x value to symlog scale with zero shift using Python and matplotlib.pyplot
The result is:
This code shows how to convert x value to symlog scale with zero shift using Python and matplotlib.pyplot
Two ways to align ylabels for two plots using Python and matplotlib.pyplot
The result is:
This page shows two ways to align two ylabels for two subplots using Python and matplotlib.pyplot.
Generate figure with just only table using Python and matplotlib.pyplot
The result is:
This code shows how to generate a figure with just only a table using Python and matplotlib.pyplot
Generate network graph using Python and matplotlib.pyplot
The result is:
This page shows how to generate network graph using Python, matplotlib.pyplot and networkx.
Combine two figures with/without spines and ticks using Python and matplotlib.pyplot
The result is:
This code shows how to combine two figures with and without spines and ticks using Python and matplotlib.pyplot.
Remove ticks and spines (box around figure) using Python and maptlotlib.pyplot
The result is:
This page shows how to remove ticks and spines (box around figure) using Python and matplotlib.pyplot.
Interactive figure with several 1D plot and one hovertools using Python and Bokeh
The result is:
This code how to generate interactive figure with several 1D plot, one hovertools and togglable legend using Python and Bokeh. This is a continuing post of last one.
Interactive figure with several 1D plot and several hovertools using Python and Bokeh
The result is:
This page shows how to generate interactive figure with several 1D plot and several hovertools using Python and Bokeh. The way to merge hovertools will be shown in the next post.
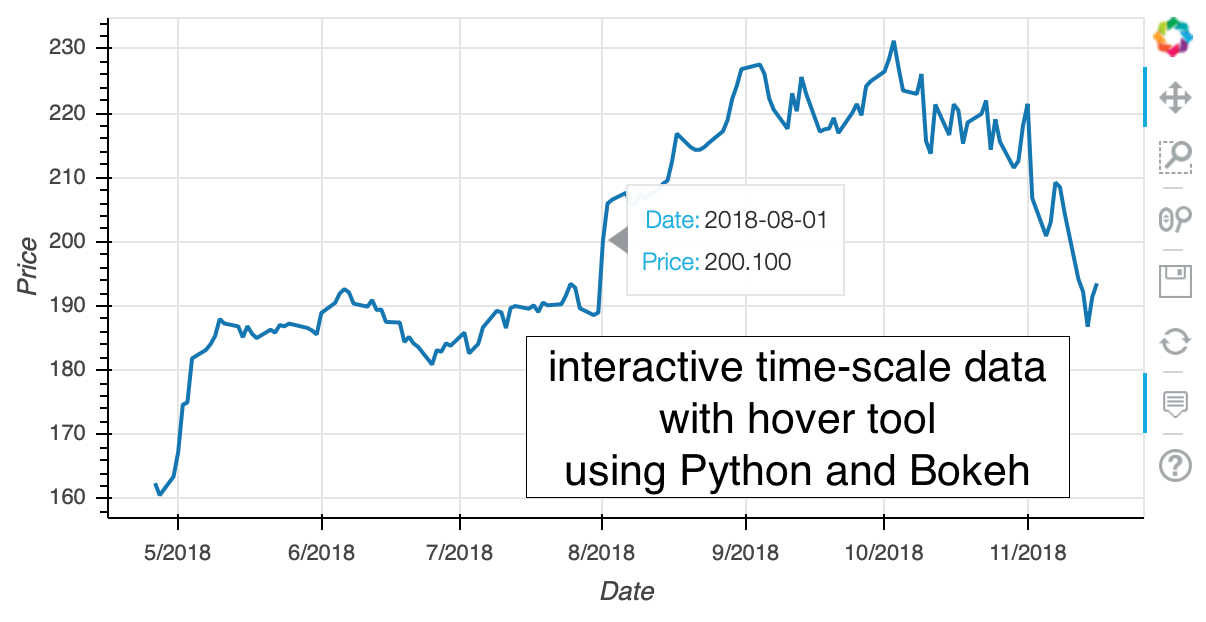
Interactive 1D time-scale plot with hovertool using Python and Bokeh
The result (static image) is:
This page shows how to generate interactive time-scale 1D line plot with hovertool (stock data) using Python and Bokeh.
Subscribe to:
Posts (Atom)