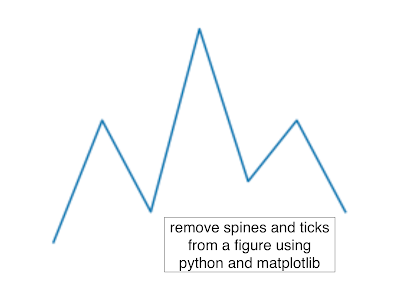
The result is:
This page shows how to remove ticks and spines (box around figure) using Python and matplotlib.pyplot.
See also:
This code shows how to combine two figures with and without spines and ticks using Python and matplotlib.pyplot
In [1]:
from platform import python_version as pythonversion
print('python: '+pythonversion())
import matplotlib.pyplot as plt
from matplotlib import __version__ as matplotlibversion
print('matplotlib: '+matplotlibversion)
Define data
In [2]:
x = [0,1,2,3,4,5,6]
y = [1,5,2,8,3,5,2]
Draw normal Figure
In [3]:
plt.figure(figsize=(4,3))

plt.plot(x,y)
plt.show()
Draw removed Figure
In [4]:
plt.figure(figsize=(4,3))

plt.plot(x,y)
plt.tick_params(axis='x', which='both', bottom=False, top=False, labelbottom=False)
plt.tick_params(axis='y', which='both', right=False, left=False, labelleft=False)
for pos in ['right','top','bottom','left']:
    plt.gca().spines[pos].set_visible(False)
plt.show()

