Decrease padding around annotation text using Python and matplotlib.pyplot
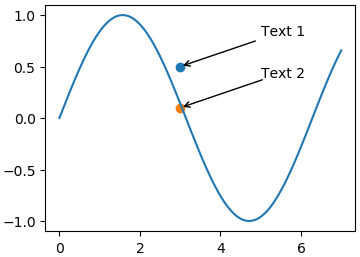
The result is:
When you struggle to draw efficient figures, you sometimes think the padding around the annotation text is to big. This page shows how to decrease the padding around the annotation text using python and matplotlib.pyplot.
Combine two contourf and two colorbar into one figure using Python and matplotlib.pyplot
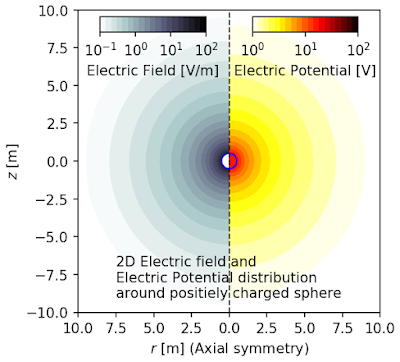
The result is:
This page shows how to combine two contourf and two colorbar into one figure using python and matplotlib.pyplot.
Combine multiple line plot and contour plot with a colorbar using Python and matplotlib.pyplot
The result is:
This code shows how to combine multiple line plots and contour plots with a colorbar in one figure using Python and matplotlib.pyplot. To combine these plots, plt.subplots with gridspec_kw options are used. The xlims are also adjusted between upper and lower plots.
Animate zoomed plot of crowded data by updating xlim using matplotlib.animation.FuncAnimation
The result is:
This code shows how to animate the zoomed subplot of original crowded subplot using Python and matplotlib.animation.Funcanimation.
Labels:
Animation,
FuncAnimation,
Matplotlib,
Python,
Simulation
Speed up generating figures by running external python script parallelly using Python and matplotlib.pyplot
The result is:
This page shows my suggestion to process data and generate figure parallelly by running some external python script.
Labels:
Contour,
Matplotlib,
Parallel,
Python,
Simulation,
SpeedUp
Plot contour figure from data which has large scale and plus-minus difference using Python and matplotlib.pyplot
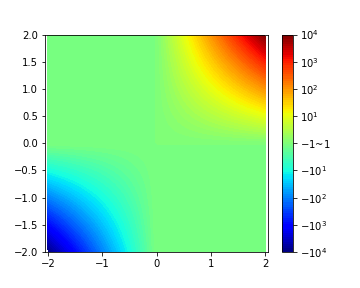
The result is:
This page shows my suggestion to generate contour figure from data which has large scale and plus-minus difference using python and matplotlib.pyplot.
Labels:
Color,
Contour,
Label,
Log,
Matplotlib,
Python,
Simulation,
Symlog
Plot 1D data which has large scale and plus-minus difference using Python and matplotlib.pyplot
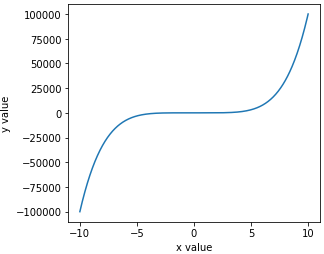
The result is:
This page shows my suggestion to generate 1D line figure from data which has large scale and plus-minus difference using python and matplotlib.pyplot.
Subscribe to:
Comments (Atom)


