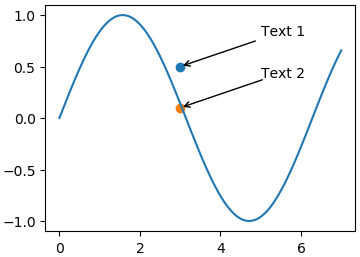
The result is:
When you struggle to draw efficient figures, you sometimes think the padding around the annotation text is to big. This page shows how to decrease the padding around the annotation text using python and matplotlib.pyplot.
In [1]:
import matplotlib.pyplot as plt
import numpy as np
%matplotlib inline
In [2]:
fig = plt.figure(facecolor='w',figsize=(4,3))
ax = fig.add_subplot(1,1,1)

# Saple data
x = np.linspace(0,7,100)
y = np.sin(x)
ax.plot(x,y)
ax.scatter(3,0.5)
ax.scatter(3,0.1)
# Annotation with normal padding around the text
ax.annotate('Text 1', xy=(3,0.5), xytext=(5,0.8),
            arrowprops=dict(arrowstyle='->'))
# Annotation with decreased padding around the text
ax.annotate('Text 2', xy=(3,0.1), xytext=(5,0.4),
            arrowprops=dict(arrowstyle='->'),
            bbox=dict(boxstyle='square,pad=-0.07', fc='none', ec='none'),)
# Output as png file
plt.savefig('decrease_padding_annotate_text.png', bbox_inches='tight', pad_inches=0.02,dpi=100)
