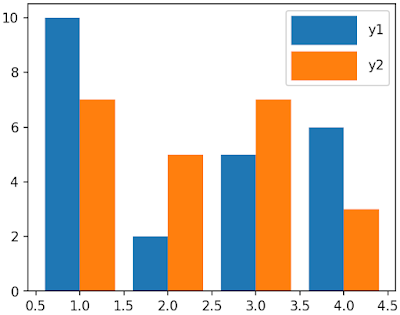
The result is:
This page shows how to increase box size of the legend for barplots using Python and matplotlib.pyplot.
In [1]:
import numpy as np
import matplotlib.pyplot as plt
%matplotlib inline
In [2]:
x = np.array([1,2,3,4])
y1 = np.array([10,2,5,6])
y2 = np.array([7,5,7,3])
Default legend with small boxes for handles of each bar.
In [3]:
plt.figure(facecolor='w', figsize=(5,4))
plt.bar(x-0.2, y1, width=0.4, label='y1')
plt.bar(x+0.2, y2, width=0.4, label='y2')
plt.legend()
plt.savefig("increase_label_size_in_legend_for_barplot1.png",
            dpi=150, bbox_inches='tight', pad_inches=0.02)
To magnify the box size in the legend for bar plots,
you can use "handlelength" and "handleheight" options of plt.legend function.
In [4]:
plt.figure(facecolor='w', figsize=(5,4))
plt.bar(x-0.2, y1, width=0.4, label='y1')
plt.bar(x+0.2, y2, width=0.4, label='y2')
plt.legend(handlelength=5, handleheight=3)
plt.savefig("increase_label_size_in_legend_for_barplot2.png",
            dpi=150, bbox_inches='tight', pad_inches=0.02)
