The result is:

This page shows how to generate normalized stacked barplot with sample number of each bar and percentage of each data using python and matplotlib.pyplot.
See also:

Python Matplotlib Tips: Generate stacked barplot using Python and matplotlib.pyplot
This page shows how to generate stacked barplot using Python and matplotlib.pyplot.
 pythonmatplotlibtips.blogspot.com
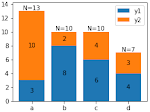
Python Matplotlib Tips: Add sample number to stacked barplot using Python and matplotlib.pyplot
This page shows how to add sample number to stacked barplot using Python and matplotlib.pyplot.
 pythonmatplotlibtips.blogspot.com
In [1]:
import numpy as np
print('numpy: '+np.version.full_version)
import matplotlib
print('matplotlib: '+matplotlib.__version__)
import matplotlib.pyplot as plt
%matplotlib inline
Sample data
In [2]:
x = ["a","b","c","d"]
y1 = np.array([3,8,6,4])
y2 = np.array([10,2,4,3])
y3 = np.array([5,6,2,5])

# memo of sample number
snum = y1+y2+y3

# normalization
y1 = y1/snum*100.
y2 = y2/snum*100.
y3 = y3/snum*100.
In [3]:
plt.figure(figsize=(4,3))

# stack bars
plt.bar(x, y1, label='y1')
plt.bar(x, y2 ,bottom=y1,label='y2')
plt.bar(x, y3 ,bottom=y1+y2,label='y3')

# add text annotation corresponding to the percentage of each data.
for xpos, ypos, yval in zip(x, y1/2, y1):
    plt.text(xpos, ypos, "%.1f"%yval, ha="center", va="center")
for xpos, ypos, yval in zip(x, y1+y2/2, y2):
    plt.text(xpos, ypos, "%.1f"%yval, ha="center", va="center")
for xpos, ypos, yval in zip(x, y1+y2+y3/2, y3):
    plt.text(xpos, ypos, "%.1f"%yval, ha="center", va="center")
# add text annotation corresponding to the "total" value of each bar
for xpos, ypos, yval in zip(x, y1+y2+y3, snum):
    plt.text(xpos, ypos, "N=%d"%yval, ha="center", va="bottom")

plt.ylim(0,110)

plt.legend(bbox_to_anchor=(1.01,0.5), loc='center left')
plt.savefig('normalized_stacked_barplot_with_number.png', bbox_inches='tight', pad_inches=0.02)
